EpIG: Epiphyte Inventory Group
Vascular epiphytes are a conspicuous component of most tropical forests, comprising up to 50% of the local diversity in some tropical rainforests. While small-scale distributional patterns are increasingly well understood, there is limited knowledge of their regional diversity patterns, and little theoretical understanding of the processes and mechanisms driving diversity in this ecologically important group. Diversity patterns are the result of multiple processes at multiple scales. Without studying patterns and drivers at a large scale we will not be able to understand epiphyte diversity fully.
|
EPIPHYTES
Germinate and grow non-parasitically on other plants without rooting in the soil. 
A species of Barkeria spectabilis Bateman ex Lindl (Orchidaceae) in the oak forest of Mexico at 1 550 masl. |
Most up-to-date conceptualisationZotz & Einzmann (2023) devised a new semi-quantitative approach, parting away from the binarism of epiphytes vs. non-epiphytes (Zotz et al., 2021). Epiphytism may be seen as part of a continuum across substrate preferences reflecting the variation observed in nature. This new concept is based on the assessment of the species growing sites treating lithophytic, terrestrial, and epiphytic habitats within a gradient. They found that a majority of species show clear preferences for either epiphytic, lithophytic or terrestrial growth, while strict specialisation is not as common. Although this approach provides a more realistic view of the species' ecological attributes, a large amount of data, at the population level is required. Also, the hemiepiphyte issue remains as is not covered with this approach.
|

Distribution of 61 Trichomanes species in the epiphyte-lithophyte-terrestrial space. Symbol size varies with the nr of species with the same Epiphyte-, Litophyte- or Terrestrial values (Zotz & Einzmann, 2023).
|
Conceptually, there are two other types of structurally dependent plants sharing the habitat and some ecological characteristics with epiphytes. “Hemiepiphytic” and climber species are also structural-dependent flora, with a convoluted conceptualization. Most hemiepiphytes remain structurally dependent on their host for their entire life. Tropical ecologists distinguished primary and secondary hemiepiphytes as two structurally dependent life forms with an epiphytic phase at, the beginning or the end of their ontogeny, respectively. Zotz et al., 2021 and Zotz et al., 2021 recommend, given the current uncertainty, to discontinue the use of "secondary hemiepiphyte", instead, use of neutral terms like “nomadic vine".
|
HEMIEPIPHYTES
Germinate on other plants, epiphytic stage, but later establish contact with the soil. 
A species of Clusia (Clusiaceae) in the lowland rainforest of Panama at 200 m asl. |
NOMADIC VINES
Germinate on the ground and may lose their initial contact to soil while climbing the host. 
Monstera egreigia Schott (Araceae) in a Mexican rainforest. (Foto T. Kroermer) |
OUR GOAL:
To bring together epiphyte inventory data from across the world
EPiG-DB 1.0: A Database of Vascular Epiphyte assemblages in the Neotropics
The current version of EpiG-DB consists of 463,196 individuals from 3005 species (including 960 morphospecies) belonging to 60 families and 411 genera, collected from 18148 relevés (17762 trees and 386 understory plots) with 76% of trees sampled within 687 forest plots (Fig. 1).
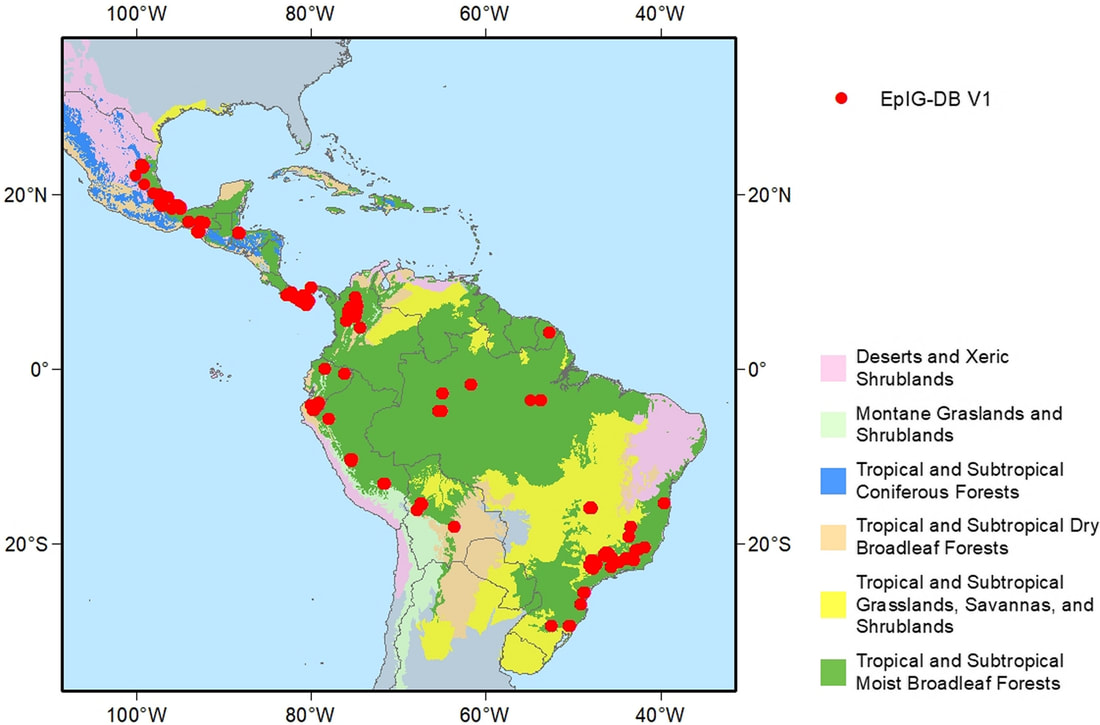
Figure 1: Spatial distribution of 80 datasets integrated in EpIG‐DB 1.0 across the Neotropic WWF biomes.
Datasets' spatial distribution indicates data deficient areas; for instance, the Amazon & the Caribbean, where data needs to be urgently collected.
|

Figure 2: Climate envelope of EpIG‐DB 1.0 data across Whittaker biomes.
Data are distributed along a broad climate range, covering tropical and subtropical biomes where epiphytes typically grow, but also cold & very rainy tropical regions.
|
All in all, 80 datasets have been gathered from 9 countries, 6 biomes and 45 ecoregions in the Neotropics (Fig. 1). More than half of the relevés (66%) are distributed in natural ecosystems, only 19% are found in anthropogenic areas and 15% in semi-natural ecosystems. We need more data from disturbed or regenerating sites!
We aim at using this database, EpIG-DB, to test the generality of the findings of individual case studies to define large scale diversity patterns of epiphyte diversity. We also plan to use EpIG-DB to test general ecology diversity hypotheses of interest for the development of ecological theory and the understanding of the mechanisms underpinning diversity, not only in the tropics but also in other ecosystems.
We aim at using this database, EpIG-DB, to test the generality of the findings of individual case studies to define large scale diversity patterns of epiphyte diversity. We also plan to use EpIG-DB to test general ecology diversity hypotheses of interest for the development of ecological theory and the understanding of the mechanisms underpinning diversity, not only in the tropics but also in other ecosystems.
|
EpIG publications: In our most recent publication we assessed the extinction risk of 11,446 epiphyte species and found nearly 60% (6,721 species) are at risk. This includes 1,766 critically endangered, 3,537 endangered, and 1,418 vulnerable species. Most are in Central America, the northern Andes, and the Atlantic Forest. These areas are biodiversity hotspots, showing that epiphytes are especially vulnerable and need urgent conservation.
|

The number of threatened epiphyte species within the Neotropics (Carmona-Higuita et al. 2024).
|
Do you want to read about what went into the making of the paper, or why studying epiphytes is very hard! and get to know EpIG members? please visit the Journal of Vegetation Science Blog.
Current projects
Drivers of vascular epiphyte diversity in the Neotropics
|
Vascular epiphytes, non-parasitic plants growing on other plants, are crucial to tropical forest canopies. They comprise about 10% of the world's vascular plant diversity and 39% in the Neotropics. They provide vital ecological services and influence canopy structure and complexity. Their distribution is shaped by elevation and latitude, with low water availability adaptations possibly limiting their cold tolerance. Epiphyte richness declines with latitude faster than terrestrial plants and peaks at mid-elevations.
The impact of regional differences on epiphyte diversity needs to be better understood, with most studies being localized. Recent research has pointed out the need for more comprehensive studies on species richness and abundance at larger scales. Understanding these biodiversity patterns is essential, especially with global change. This study aims to identify the drivers of Neotropical epiphyte diversity using a new database with data from 9,000 host trees, 150,000 epiphyte individuals, and 1,500 species across 25 ecoregions. Using advanced modelling techniques, we will analyse elevational and latitudinal patterns of richness and abundance, considering environmental, geographical, and historical factors. We expect climatic variables, especially temperature and precipitation, to significantly influence these patterns, with temperature increasing abundance and precipitation limiting richness. |

|
The effect of forest loss on vascular epiphyte diversity changes across
the Neotropics

|
Forest loss threatens species diversity in the Neotropics, mainly due to deforestation for griculture. This loss affects species richness and abundance at both local and regional scales. Locally, some species can recolonize, but large-scale forest loss disrupts dispersal and connectivity, leading to species decline and altered communities. The influence of habitat characteristics, such as conservation status and environmental conditions, further modulates the impact of forest loss. Understanding these effects is crucial for effective conservation strategies, especially in highly diverse regions like the Neotropics.
As forests shrink, biodiversity declines due to reduced habitat area and disrupted species demographics. Most models overlook these demographic effects, focusing only on species-area relationships. To address this, we'll study epiphyte biodiversity at multiple scales, considering species richness, abundance, and aggregation patterns. This multi-scale approach will provide deeper insights into how epiphyte communities respond to habitat loss. Epiphytic plants, sensitive to environmental changes, are ideal for studying forest loss impacts. Comprehensive spatial and temporal assessments will guide conservation efforts to mitigate biodiversity loss. |
Climate Challenges: Assessing the Future Landscape for Neotropical
Vascular Epiphytes and Protected Areas
|
Contact: Mariana Murakami
UKCEH - UK Centre for Ecology and Hydrology Climate change is causing a global-scale biological response, impacting species richness, composition, and distribution globally, causing extinction or range shifts. Among the 100,000 Neotropical seed plants, vascular epiphytes stand out for their ability to thrive in various forest canopy environments, supporting diverse fauna. Their richness patterns may be similar to that of other plants and even animals, making them important for studying climate change effects, as they can serve as a model to forecast the impact of global changes on the distribution of different taxa. Epiphytes, with their wind-dispersed seeds, short life cycles, and rapid colonization, are suitable climate change indicators. This study will use species distribution models (SDMs) to predict future changes in the distribution and protected area coverage of Neotropical vascular epiphytes under different carbon emission scenarios (e.g., SSP370 and SSP585). We expect that climate change will reduce both the distribution area of these species and the percentage occurring in protected areas. To manage computational demands, we will pre-select species based on climatic niche analysis, focusing on those most likely to be displaced by climate change. |

Spatial distribution of Protected Areas (blue) throughout nonintact (yellow) and intact land (green). Ward. et al. 2020. Just ten per cent of the global terrestrial protected area network is structurally connected via intact land. Nat Commun.
|
Ecology, ecophysiology, and asexual reproduction of Vriesea flava
(Bromeliaceae), a very rare epiphytic species
|
Contact: Vinicius José Silva Barbosa Moreira (PhD student)
Universidade Federal de Alfenas, Instituto de Ciências Naturais, Brasil. 
|
Tropical biomes, known for their species diversity, have suffered significant devastation due to the conversion of forests into pastures and crops, disrupting ecosystem balance. Rare and endemic species are especially vulnerable to habitat loss and human activities, facing a higher extinction risk than widespread species. These impacts, including effects on pollination and seed dispersal, are often subtle.
Epiphytic plants, which can represent over 50% of plant species richness in some regions, are particularly diverse. Bromeliaceae, a Neotropical epiphytic family, is notable for its species diversity. Bromeliads rely on various pollinators such as birds, insects, and bats, and their distribution in humid tropical forests is closely tied to water availability and microhabitat moisture. High-intensity sunlight can harm bromeliads, especially at early stages. In south of Brasil, Machado, a small population of the threatened epiphytic species Vriesea flava (Bromeliaceae) exists in a single forest fragment. Given its rarity and limited distribution, understanding its biological characteristics is crucial for conservation. This project aims to comprehensively study the ecology and ecophysiology of V. flava to support its population increase and reintroduction into nearby forests. We will examine V. flava’s occurrence, population dynamics, reproductive ecology, and responses to stress from light intensity and moisture variations. |
Biogeography of neotropical vascular epiphytes

Contact: Derio Antonio Jiménez-López (PhD student) Departamento de Conservación de la Biodiversidad, El Colegio de la Frontera Sur, San Cristóbal de las Casas, Mexico. The Neotropics are divided into biogeographical regions due to their evolutionary history. Understanding the boundaries between these regions is key to studying the evolution of floras. Vascular epiphytes are an ideal group for illustrating this regionalization. However, current knowledge on Neotropical epiphytes is biased at the regional scale. While climate is known to influence epiphyte distribution, historical factors like geological and climatic changes also shape current biogeographic patterns. We propose to investigate the phytogeographic regionalization of Neotropical epiphytes, the contributions of ecological and historical factors, and the ancestral ranges and diversification areas of the main epiphyte families. To do this, we will conduct a literature review to create a workflow for constructing biogeographic regions. Using this workflow, we will create regions for all Neotropical epiphytes with data from the EpiG database and phylogenetic megatrees. We will use linear models with phylogenetic beta diversity as the response variable and ecological and historical factors as predictors. |

Taxonomic and phylogenetic regionalisation of epiphytic Polypodiaceae across the Neotropics.
We expect to identify: (1) Andes, with highland species and high diversity; (2) Amazon, with lowland species; (3) Brazilian Atlantic, with endemic species; and (4) Mesoamerica, influenced by South American flora. Also, strong floristic distinction between regions & ancestral areas of the highest species richness or endemism will be in the Andes, Amazon, or Brazilian Atlantic.
|
The BIOgeography and COnservation priorities of Neotropical Vascular
Epiphytes (BIOCON-VEP)

Contact: Maria Judith Carmona-Higuita (PhD student)
Faculty of Biology, University of Marburg, Marburg, Germany The Neotropics, rich in biodiversity, are threatened by land use and climate change, making the preservation of its ecosystems urgent. Vascular epiphytes, vital yet vulnerable to these threats, have gained attention for their ecological significance. This research aims to elucidate Neotropical vascular epiphytes' biogeographical patterns and conservation priorities, addressing key gaps in our understanding of their distribution and vulnerability. I will map the geographic distribution of epiphyte species using species distribution models based on biodiversity records and environmental data, which will reveal their geographic ranges and potential responses to climate and land-use changes. Next, I will analyze endemism patterns among Neotropical epiphytes, identifying regions with unique and rare species to inform targeted conservation efforts. I will conduct species-level conservation assessments to identify those at the highest risk of extinction according to IUCN Red List criteria. Collaborating with experts and taxonomists across Latin America, we aim to establish a dedicated epiphyte IUCN group. These assessments will form the foundation for conservation efforts and policy development. |

Number of endemics per biogeographic provinces of all vascular epiphyte species combined (total) and the five richest families in the Neotropics individually, based on convex polygons (Carmona-Higuita et al. In revision).
|
The anticipated outcomes include mapping diversity and endemism hotspots for epiphytes, species distribution maps, and an updated IUCN Red List of epiphytes. This research will also generate ranked lists of priority species and areas for conservation. By enhancing our understanding of vascular epiphytes and their vulnerabilities, this study supports the preservation of biodiversity and sustainable ecosystems in the Neotropics, addressing the region's ongoing biodiversity crisis.
Big size, big responsibility: Key traits in the epiphytic orchid-host
interaction network in a Peruvian montane cloud forest
Contact: Gabriela Garcia-Reynaga (PhD student)
Centro de Ornitología y Biodiversidad (CORBIDI), División de Ecología Vegetal, Perú
Centro de Ornitología y Biodiversidad (CORBIDI), División de Ecología Vegetal, Perú

Epiphytic orchids represent one of the most important and threatened biodiversity components of tropical rainforests. Their survival is closely related to the ecology of their habitat, in particular the interactions with their hosts. These interactions can be described as networks in which certain hosts stand out and make possible the prevalence of the majority of epiphyte species occurring in an area, and this can be quantified by a parameter called "strength". Hosts allow a successful establishment of epiphytes, this capacity is related to certain eco-morphological traits. This work aims to determine these traits in a network of interactions between epiphytic orchids and their hosts in a montane cloud forest in Pasco between 2200 to 2360 m asl. For this purpose, the richness and abundance of orchids in canopy and understory hosts were recorded. For each host, eco-morphological traits related to structure and microhabitats were recorded. To determine which traits are important in determining this strength, the parameter was modelled as a function of eco-morphological traits using generalized linear models. The models indicated that trunk diameter and moss cover were important determinants of the strength parameter for the understory, while trunk height was important at the canopy level. Larger trees promote the complexity of interactions with epiphytic species, possibly due to the greater diversity of microhabitats and areas for colonization. In addition, bark with greater moss cover provides extra water and nutrients. These findings support previous information and highlight the importance of physical and ecological host traits in the assembly of epiphytic orchid communities.
Influence of Anthropogenic Disturbance on the Diversity of Vascular Epiphytes in Remnant Forests of the Sacred Valley of the Incas, Cusco - Peru
|
The vulnerability and fragmentation of terrestrial ecosystems, such as the inter-Andean valleys, have heightened the risk of biodiversity extinction. The Sacred Valley of the Incas, with its complex geomorphology and micro-valleys, is experiencing significant biodiversity loss due to expanding agriculture and population growth. The remaining forests, once lush with vegetation, are now reduced to small patches. Vascular epiphytes, which depend on trees and are sensitive to microclimate changes, are particularly threatened.
This study aims to evaluate the impact of human disturbance on the diversity of vascular epiphytes in the remnant forests of the Sacred Valley in Cusco, Peru, a seasonally dry tropical forest at 3450 m. asl. We will assess the richness and abundance of vascular epiphytes in five remnant forests, surveying all trees in 35 10x10m plots. |


Anthropogenic disturbance variables will be categorized using ground truthing and a shapefile of land use cover. We will calculate the percentage of cover for different categories within radii of 100, 200, 300, and 400 meters from each plot's centre, using a multi-scale landscape approach. To determine the effects of human activity, forest structure, and mesoclimate on epiphyte diversity, we will use generalized linear mixed models with species abundance and richness as dependent variables. This research will help us understand how anthropogenic factors influence biodiversity and inform conservation strategies for these vulnerable ecosystems.
Disentangling the habit of epiphytic Atlantic Forest Bromeliads

Contact: Daihana Arango Vásquez (Master student)
Universidade Federal de Alfenas, Instituto de Ciências Naturais, Brasil.
The Bromeliaceae family, with 3,403 species, is widely distributed across the Neotropics and ranks as the second-largest family of epiphytic vascular plants, tied with the Araceae family. Bromeliads surpass even the Orchidaceae in vegetative form diversity and habitat range, occurring as epiphytic, terrestrial, and lithophytic. The terms "epiphytic species," "terrestrial species," or "lithophytic species" are often used ambiguously to describe species that can exhibit any or all of these habits, overlooking intraspecific variation.
Intraspecific variation within species, though less studied, is crucial for understanding community composition. Our research focuses on three diverse Bromeliaceae genera in the Atlantic Forest: Aechmea (119 species), Billbergia (32 species), and Nidularium (35 species). We will use a quantitative approach to characterize their habitat patterns and quantify the prevalence of their growth forms using a continuous numerical method. This study aims to shed light on the ecological roles and adaptability of these bromeliads within their ecosystems.
Is there life after death? Impacts of Dead Phorophytes on Vascular
Epiphyte Richness and Composition

Contact: Camila Nardy
Centro Nacional de Cosnervação da Flora (CNCFlora) - Jardim Botânico do Rio de Janeiro, Rio de Janeiro, Brasil
Vascular epiphytes are vital for forest diversity, often thriving on older and larger host trees. However, when these hosts die, epiphyte diversity typically declines. Some studies suggest that epiphyte richness can persist in decaying wood, but little is known about this process.
This study focuses on standing dead hosts of Eremanthus erythropappus ("Candeia") and their role in vascular epiphyte colonization and recruitment in dwarf cloud forests at Ibitipoca State Park. We set up 20x10m plots in three forest types with different soils and analyzed the alpha and beta diversity of both living and dead-standing phorophytes.
Results showed that dead phorophytes hosted 47% of the epiphyte species found on living trees, despite lower overall abundance (12%). This highlights the importance of microclimate for epiphyte colonization. Deadwood supports forest regeneration and provides future habitats. "Candeia" trees, both living and dead, had similar epiphyte compositions due to their structure and bark texture. The most diverse families, Orchidaceae, Bromeliaceae, and Polypodiaceae, thrived in both living and deadhost trees, aided by the high humidity and altitude of dwarf cloud forests, which support epiphyte establishment despite the loss of the host tree's microclimate.
Commensalistic epiphyte-phorophyte networks in Brazilian Atlantic
Forest ecosystems

Contact: Talitha Mayumi Francisco
Instituto Nacional da Mata Atlântica Vascular epiphytes grow on other plants (host trees) without parasitizing them, using them as structural support. These relationships, both horizontally (among host tree species) and vertically (from the trunk base to crown), can be analyzed as ecological networks using metrics like nestedness, connectance, specialization, modularity, and robustness to describe the commensalistic interaction. Understanding these network properties helps us grasp the patterns of epiphyte-host tree interactions and the roles of each species. This is crucial for managing and conserving species, especially vulnerable groups like vascular epiphytes on inselbergs, which are highly threatened ecosystems. This study aims to investigate the horizontal and vertical interaction patterns between epiphytes and host trees in the Atlantic Forest, focusing on forests and inselbergs, and identify the factors shaping these interactions. |

|
Tropical inselbergs as ecological refuges for vascular epiphytes

Contact: David R. Couto & Talitha Mayumi Francisco
Instituto Nacional da Mata Atlântica - INMA Inselbergs (isolated mountains) are geographically isolated habitats with strong environmental filters, harbouring many endemic and threatened species. A little-know vegetative component of inselberg vegetation worldwide are vascular epiphytes. This project aims to identify the epiphytic flora associated with woody vegetation and forest islands in Brazilian Atlantic Forest inselbergs, originally surrounded by seasonal forest. Specifically, we want: (1) to characterise the taxonomic composition of the vascular epiphytic flora and its host trees, as well as to evaluate the presence of threatened, exotic, and rare species and their geographic distribution; (2) to examine the importance of microhabitats in structuring the epiphyte community; and (3) to determine the relative importance of host tree association, environmental conditions, and space in explaining the relative abundances and diversity of epiphytes. The output will provide baseline information about the role of inselbergs in the conservation of epiphytic flora, as well as expand the knowledge on the distribution patterns of epiphytic communities in the Atlantic Forest, contributing to the conservation of this biological group and tropical inselbergs. |

|
Spatial and Temporal Dynamics of Vascular Epiphytes
from the Andes to the Amazon

Contact: Edith Rosario Clemente Arenas (PhD student)
Universidad Nacional Mayor de San Marcos, Perú. Neotropical forests are highly diverse, with the Andes creating various habitats along elevation gradients. Epiphytes, which grow on trees for support, thrive in these forests by exploiting the vertical gradients of light, moisture, and nutrients. These forests, from the treeline through cloud forests to the Amazonian lowlands, host a wide variety of vascular epiphytes adapted to different conditions of temperature, humidity, and light at each elevation, adding to the ecosystem's complexity and richness. |

|
This project will study vascular epiphyte diversity in the Kósñipata Valley, Cusco, Peru. We will evaluate their spatial and temporal dynamics, examining how epiphyte species richness and abundance change over time (tree age) and space (elevation) across three elevational belts. We will also investigate the factors limiting epiphyte establishment, growth and maintenance along the forest-puna ecotone (treeline), providing insight into the mechanisms regulating epiphyte biodiversity and their potential responses to environmental changes.
If you wish to contribute to or be part of EpIG-DB, please get in touch with us by filling this form, we will get in touch ASAP.
International Workshop on Vascular Epiphytes
|
We met in Marburg (Germany) from August 30th to September 1st. We were 25 scientists from Latin America and Europe. For a longer and more detailed video, please click here.
The goals accomplished were:
|
|
EpIG-DB is funded by:
|
|
|
Design and content by Glenda Mendieta-Leiva and Derio Antonio Jiménez López and contributors (previously: Rosa María Villanueva Espinoza & Helena Einzmann).
